Download
Plugin for ImageJ / Fiji
[Version 11.11.2015]
Fast Spot Detection with Accurate Size Detection • ImageJ/Fiji plugin
Outline
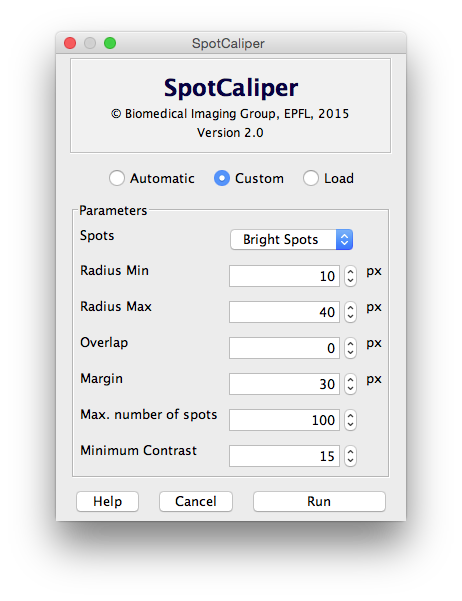
SpotCaliper is a wavelet-based image-analysis software providing a fast automatic detection scheme for circular patterns (spots), combined with the precise estimation of their size. It is implemented as an ImageJ plugin with a complete user interface. The user is allowed to edit the results by modifying the measurements (in a semi-automated way), extract or load data, or do further analysis. The fine tuning of the detections includes the possibility of adjusting or removing the original detections, as well as adding further spots.
Reference
Zsuzsanna Puspoki et al., "SpotCaliper: Fast Wavelet-based Spot Detection with Accurate Size Estimation," Submitted to Bioinformatics Oxford, July 2015.
Video Tutorial
Main features
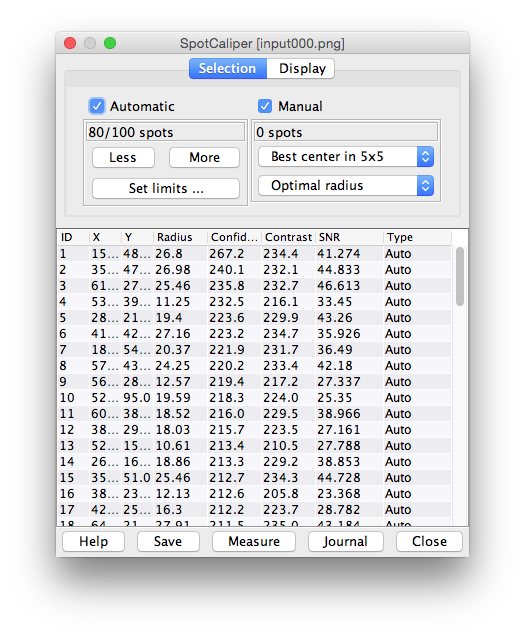
SpotCaliper is able to automatically find spots of varying size, and gives a precise measurement on their radius. The detections are collected in a table, displaying the following parameters: unique identifier (ID) of the spot, its location (x and y coordinates), radius, confidence, contrast, SNR and type.
The detected objects are visualized by their outline, covered with a variable opacity disk, or both of them. There is a possibility to label the spots either by their ID, their radius, their confidence level, their contrast or their SNR. The center of the spots are optionally shown as well with a cross.
There is a direct connection between the table and the visualization of the spots. Once the row of the spot is highlighted in the table, the corresponding spot appears automatically with an inverted color. The same way, once a spot is selected on the image, the corresponding row is highlighted too.
There is a possibility to fine tune the given measurements, and also to postprocess the data.
User interaction
Software
The software is a plugin running on ImageJ or Fiji. ImageJ is a general purpose image-processing package under public domain licence; it runs on several platforms: Unix, Linux, Windows, Mac OSX.
Installation
Usage
Distribution
The software is freely available for research purposes. However, it should not be redistributed without the consent of the authors. We expect the user to include a citation of this publication whenever presenting or publishing results that are based on the ImageJ plugin SpotCaliper.
Test images
|
Real images |
|
|
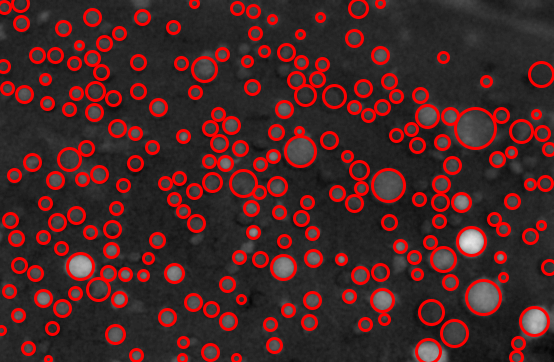
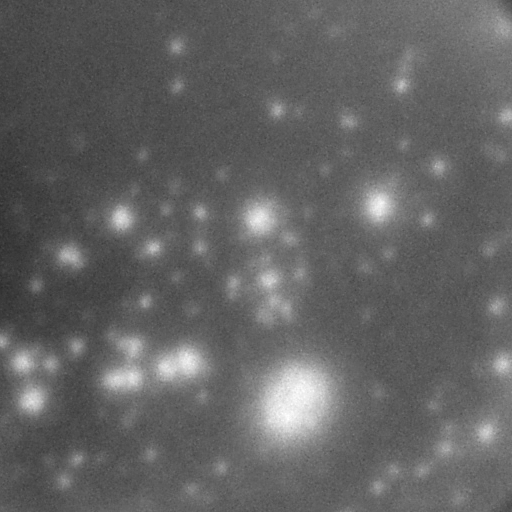
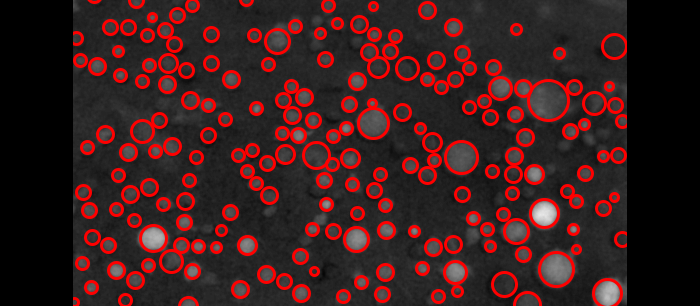
Fluorescence microscopy image |
Result of the SpotCaliper |
|
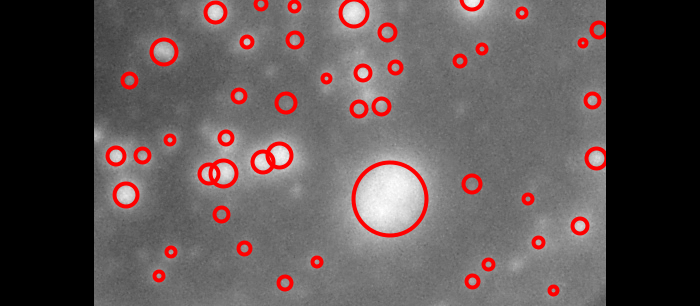
EliSpot image |
Result of the SpotCaliper |
|
Control images |
|
|
For these experiments on control images, |
|
|
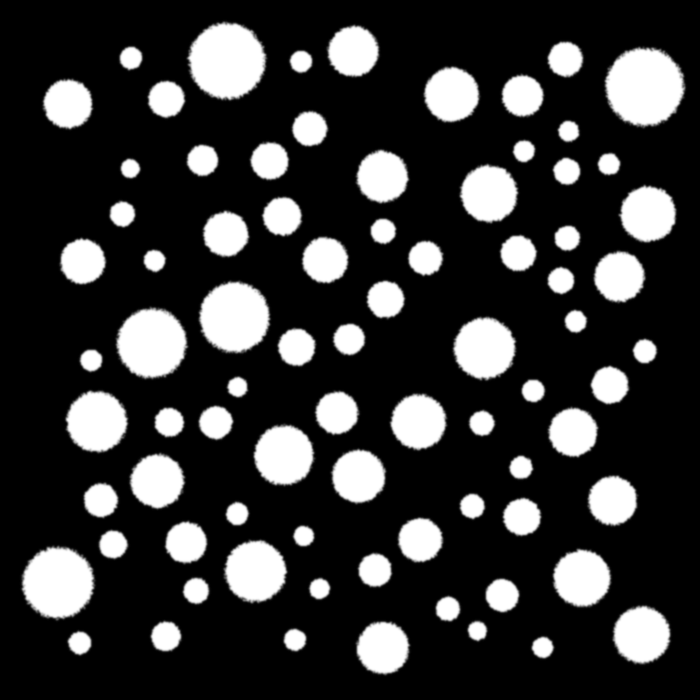
Synthetic image, no noise |
Result of the SpotCaliper: 80 detected spots |
|
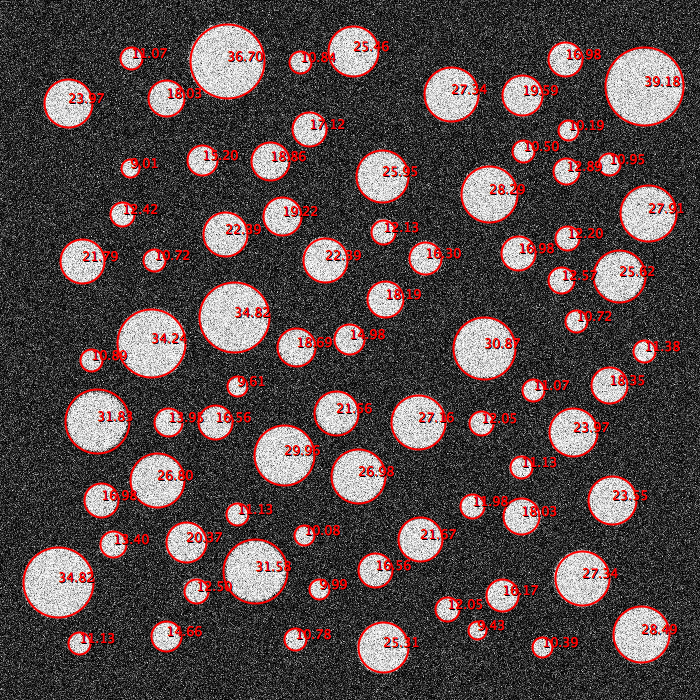
Synthetic image with additive gaussian noise |
Result of the SpotCaliper: 80 detected spots |
|
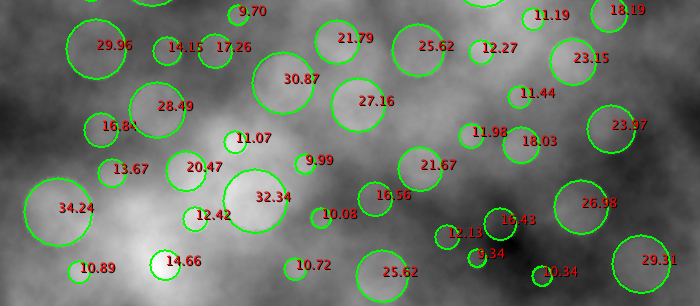
Synthetic image with a Brownian motion background |
Result of the SpotCaliper: 79 detected spots |