Empirical Sensitivity, Specificity, and Bias of Wavelet-Based Statistical Parametric Mapping (WSPM)
D. Van De Ville, M. Seghier, F. Lazeyras, T. Blu, M. Unser
Proceedings of the Thirteenth Annual Meeting of the Organization for Human Brain Mapping (HBM'07), Chicago IL, USA, June 10-14, 2007, paper no. 336 TH-PM.
Introduction
Wavelet-based statistical parametric mapping (WSPM) provides a framework that combines adaptive denoising in the wavelet domain with statistical testing in the spatial domain [1]. It guarantees strong type I error control and thus high confidence in the detections. WSPM is available as a toolbox for SPM2. Using multi-session experimental data, we estimate the empirical sensitivity, specificity, and bias of WSPM (various wavelet transforms) and SPM2 (various smoothing).
Material and methods
Data acquisition: Experiment with auditory stimulation (Philips 1.5T scanner; TR=1.2s; spatial resolution 1.8x1.8x3mm). Subject exposed to single-frequency acoustic stimulation during the activation condition of a block paradigm. Four sessions, each spanning 250 volumes.
Analysis: Standard preprocessing and the general linear model (GLM) setup done using SPM2, including regressors from the realignment procedure and the autoregressive model for serial correlations.
For each session, maps are obtained for a broad range of significance levels with
- SPM (4mm, 6mm, 8mm smoothing, notice that 4mm is the lowest admissible for GRF theory);
- WSPM (unsmoothed data, orthogonal linear B-spline wavelets, 2D slice-by-slice and 3D, 1 and 2 iterations);
- Simple voxel-by-voxel GLM estimates (unsmoothed data).
SPM compensates for multiple testing using the GRF theory, while WSPM and the voxel-by-voxel test use simple Bonferroni correction.
Reproducibility study: The consistency of the detection maps over the 4 sessions is assessed using a reproducibility study [2]: we estimate the empirical sensitivity and specificity from a binomial mixture model for the histogram of the cumulative detection maps. Additionally, we estimate the bias of the methods as the sum of the absolute differences between the contrast before thresholding and the one of the voxel-by-voxel approach.
Discussion
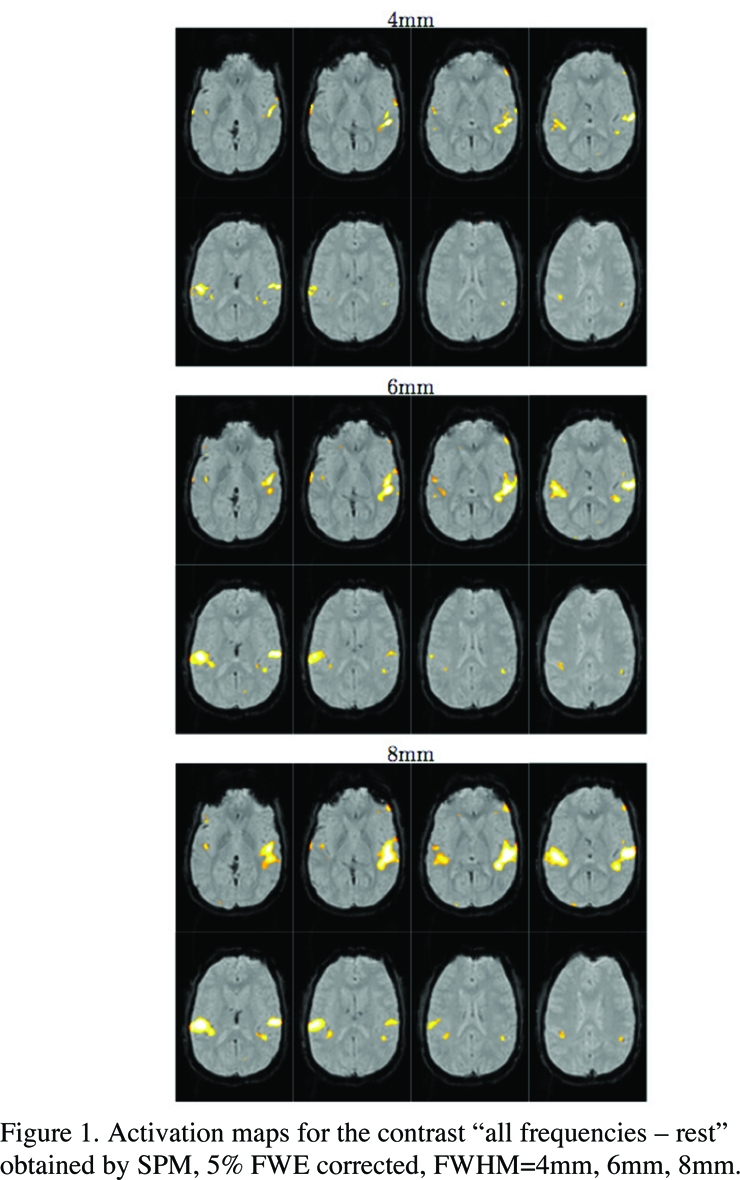
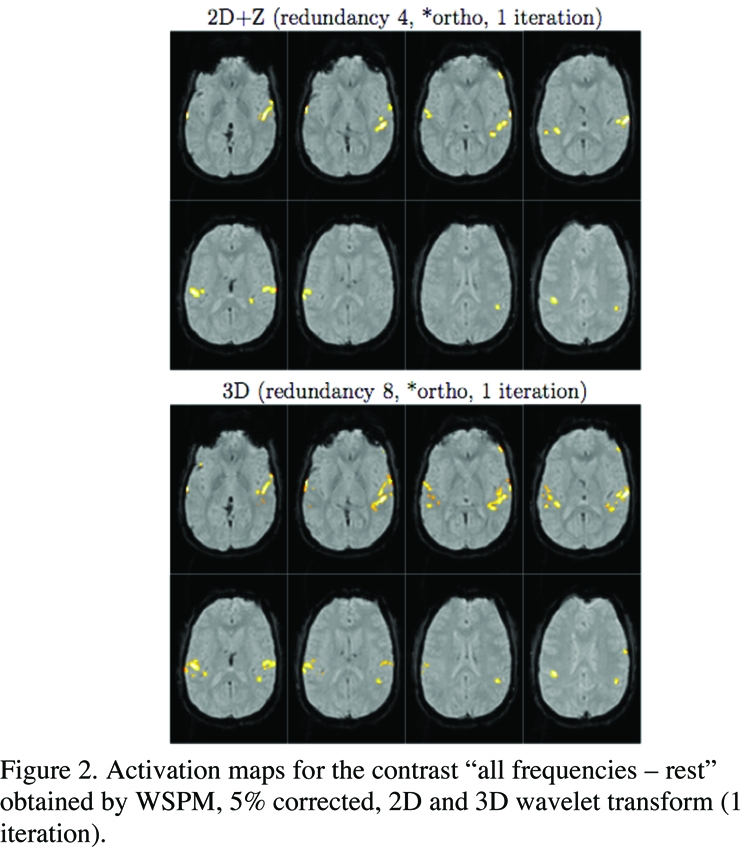
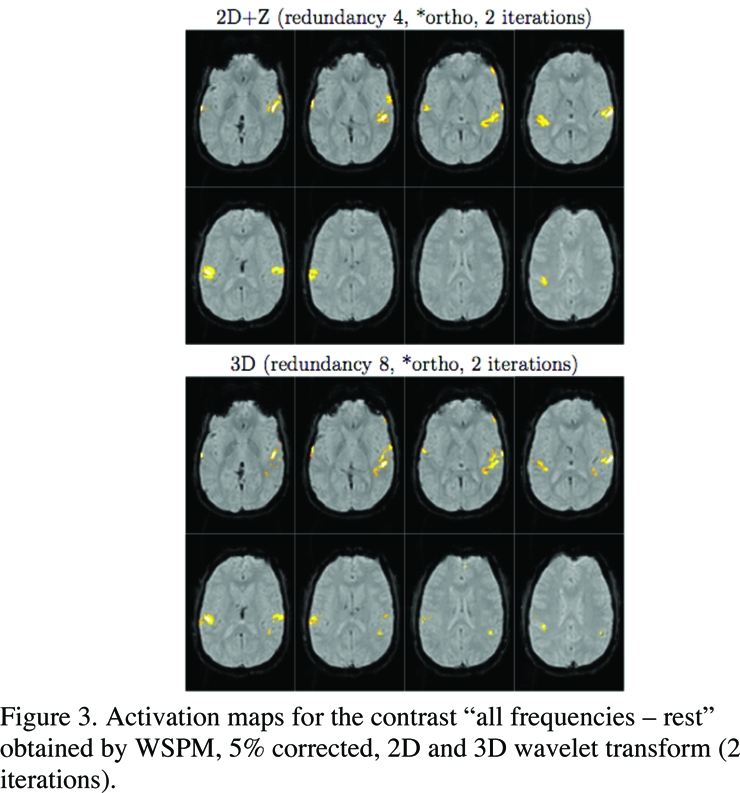
In Figure 1, we show the activation maps of SPM at significance level 5% corrected. Increasing the smoothing increases the extent of the activation patterns and leads to merging of clusters. Notice that some foci are only detected for higher smoothing. In Figures 2-3, we show the activations maps of WSPM at the same significance level, but with various settings of the wavelet transform. The position and shape of the detected patterns are comparable to SPM, but the spatial definition appears to be higher. The small foci in the left auditory cortex (Fig 3, bottom) may correspond to the subdivisions of the primary auditory cortex or to different secondary auditory areas. We notice that the typical extent of the detected patterns does not depend a lot on these settings. The number of detected patterns seems to be best for the 3D wavelet transform (1 iteration).
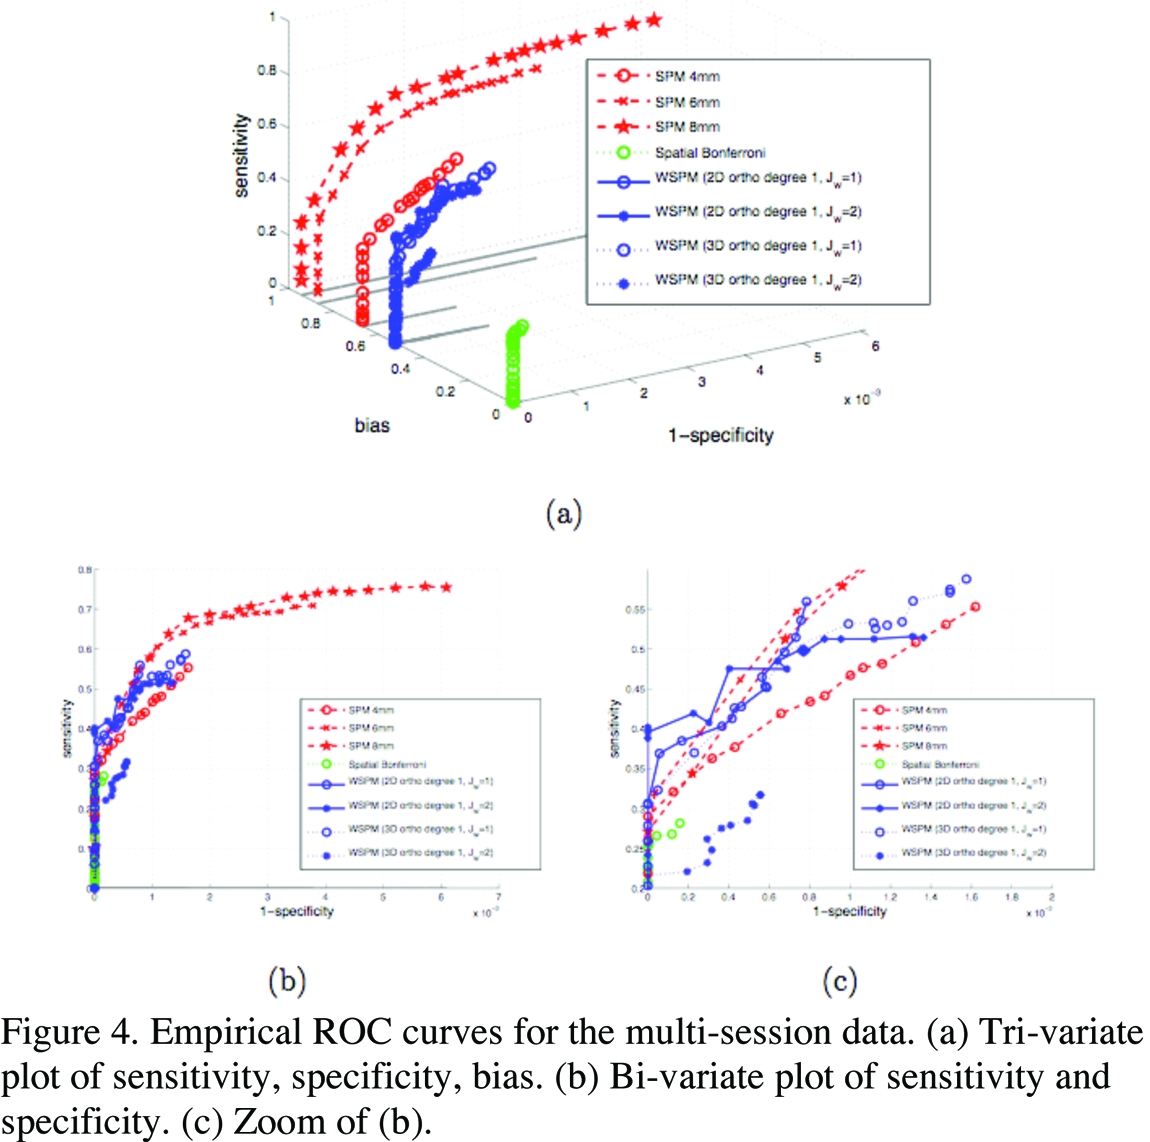
In Figure 4, we show the ROC curves obtained after estimating the parameters of the binomial mixture model for both methods. By construction, the voxel-by-voxel statistical test has no bias, but reaches a very low sensitivity. For SPM, smoothing increases the bias (as can be expected) and the empirical sensitivity-specificity. Finally, WSPM has a lower bias than SPM 4mm combined with a comparable or better compromise between sensitivity and specificity. The wiggly curve behavior is due to the non-linear operation of thresholding in the wavelet domain.
References
-
D. Van De Ville, T. Blu, M. Unser, "Integrated Wavelet Processing and Spatial Statistical Testing of fMRI Data," NeuroImage, vol. 23, no. 4, pp. 1472-1485, December 2004.
-
C.R. Genovese, D.C. Noll, W.F. Eddy, "Estimating Test-Retest Reliability in Functional MR Imaging I: Statistical Methodology," Magnetic Resonance in Medicine, vol. 38, no. 3, pp. 497-507, September 1997.
@INPROCEEDINGS(http://bigwww.epfl.ch/publications/vandeville0703.html,
AUTHOR="Van De Ville, D. and Seghier, M. and Lazeyras, F. and Blu, T.
	and Unser, M.",
TITLE="Empirical Sensitivity, Specificity, and Bias of Wavelet-Based
	Statistical Parametric Mapping ({WSPM})",
BOOKTITLE="Thirteenth Annual Meeting of the Organization for Human Brain
	Mapping ({HBM'07})",
YEAR="2007",
editor="",
volume="",
series="",
pages="",
address="Chicago IL, USA",
month="June 10-14,",
organization="",
publisher="",
note="paper no.\ 336 TH PM")