1. Radon transform
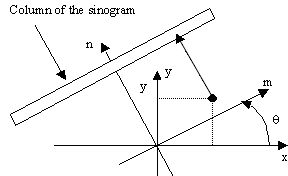
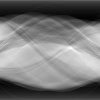
 The Radon transform (or projection) at angle θ corresponds to the lines integral of an image f(x,y) perpendicular to the direction θ . In practice, the angle is sampled uniformly between [-π /2, π /2]. The projection at angle θk is stored in a column of the sinogram p(k,m).
The coordinate (x,y) is obtained by rotating the grid coordinate (m,n) by an angle of -θ around the center of the square image (c,c). It is given by the relation:

The method transformRadon() in the file TomographySession.java implements the Radon transform of a square image. The method requires a 2D interpolation that is realized by the method getInterpolatedPixel2D() (linear interpolation).
Implementation notes:
 double[][] array = input.getArrayPixels();
 double v = array[i][j]; // access to the pixel (i,j)
Understand the code and run it on the test images (point.tif, lines.tif, circles.tif and phantom.tif) specifying different numbers of projections. By choosing the appropriate options in the dialog box, one can execute the three operations independently: (1) Radon transform, (2) filtering and (3) backprojection. Don't forget to select the correct input image.
2. Backprojection transform
The resulting image b(x,y) is obtained by backprojecting the sinogram p(k,m):

Express m as a function of x, y and qk.
Note that it is essentially the flow chart transpose of the transformRadon() (adjoint operator). Code the method inverseRadon() that computes the inverse of the Radon transform from a sinogram in the file Tomography.java.
The method requires a 1D interpolation that you have to provide in the method getInterpolatedPixel1D() (linear interpolation).
To make the computation more efficient, you should fill up the 2D array (double b[][]) and put this array in an ImageAccess at the end of the process.
 double b[][] = new double[size][size];
 ImageAccess reconstudedImage = new ImageAccess(b);
The test images are: point.tif, lines.tif, circles.tif and phantom.tif.
3. Filtered sinogram
We propose to implement three filters: (1) Ram-Lak and (2) Cosine in the Fourier domain, and (3) Laplacian in the space domain.
3.1 Ram-Lak filter
The Ram-Lak filter is defined by its frequency response H(w) = |w|. The method applyRamLakFilter() loops through the angles (k) and filters each column of the sinogram by multiplication with the transfer function in the Fourier domain.
| Code the routine generateRamLakFilter() that returns an array corresponding to the following diagram.
Implementation note: |
 |
3.2 Cosine filter
Code the cosine filter in a similar way using the method applyCosineFilter(). The frequency response of the cosine filter is H(w) = |w|.cos(π.|w|)
3.3 Laplacian filter
Code a digital version of the Laplacian filter in the method applyLaplacianFilter(). Here too, the Laplacian filter, which is defined by the mask [1,-2,1], is applied to each column of the sinogram separately.
4. Reconstruction of a sinogram
 Choose an appropriate filter to reconstruct this sinogram given in the file ctslicesino.tif
Save the image (8 bit) and insert it the report.doc.
5. Detection of lines
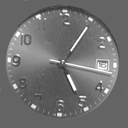
 Use the Radon transform to reconstruct an image showing only the longest needle of the image watch.tif.
Hint: The sinogram may be thresholded using the ImageJ commands.
Save the image (8 bit) and insert it the report.doc.