High Throughput Analysis of Confocal Microscopy Images
Julien Jacquemot and Clément Marti | Semester Project |
Section of Life Sciences and Technologies, EPFL | July 2013 and January 2014 |
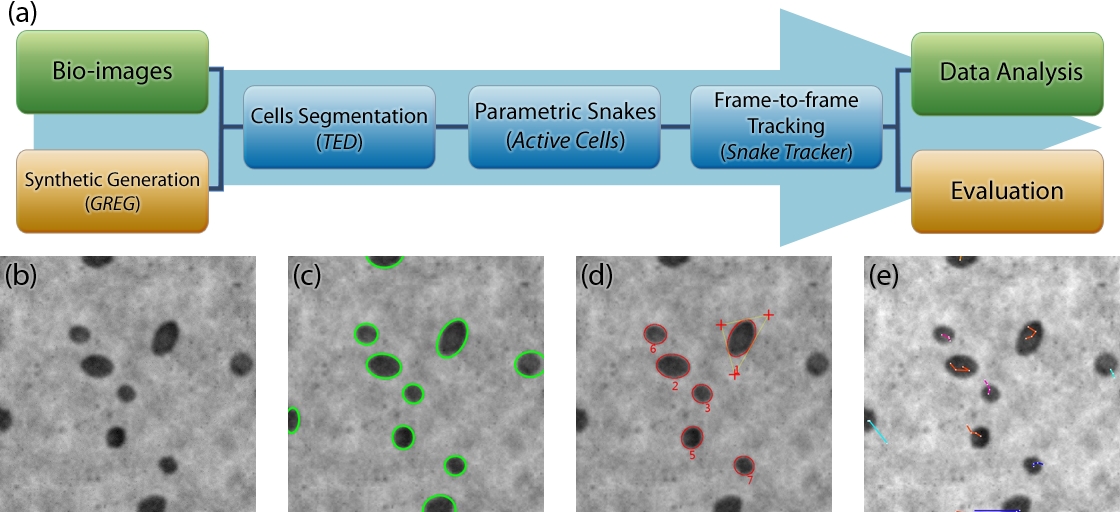
PACT: A Pipeline for Automatic 2D/3D Cell Tracking in fluorescence microscopy images
Confocal microscopy is a powerful tool to investigate cell behavior. However, it yields sizeable
datasets which make manual annotation of cell shapes and position a lengthy task.
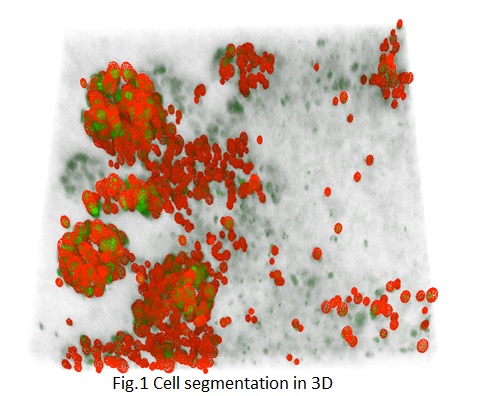
This project aims at automatically segmenting cells in 2D+t/3D+t confocal fluorescence
microscopy data by using ellipse-reproducing parametric snakes, and track them with a
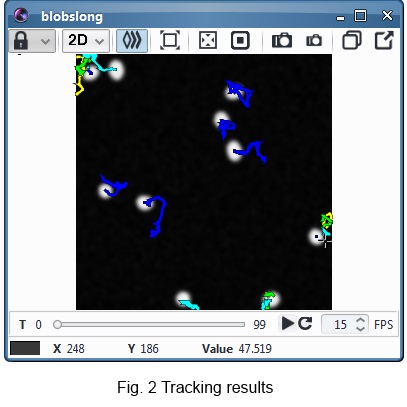
nearest-neighbour method or a kalman filter. Several plugins for the Icy bioimaging
software were developed, enabling a fast and plug-and-play integration in an automated
pipeline, with a display of the results. Results can be exported to the Icy Track Manager
for processing and synthetic data can be generated to provide ground truth.
Abstract 2013
Microscopy is one of the most powerful tools in biology. It has seen many developments along the years,
and now microscopes can acquire 3D images and repeat this over several hours, enabling to acquire
sizeable dataset to study cellular behaviour. Such datasets cannot be manually exploited, and
automatic processing is required, especially to track cells over time and record their statistics.
This project aims at segmenting cells in 3D+t confocal microscopy data by using ellipse-reproducing
parametric snakes, and track them with a nearest-neighbour method. Several plugins for the
Icy bioimaging software were developed, enabling a fast and plug-and-play integration in
an automated pipeline, with a display of the results. Cell shapes are recorded in an Excel
file and can then be accessed for further analysis.
© 2022 EPFL • • 11.08.2022