Image Processing on Microarrays
Delphine Perrottet
Micro-engineering
Student Project
Semester Project, June 2001
Introduction
The detection and understanding of new genes has been one of the most complex and fascinating problems of the past century. The arrival, about three years ago, of the microarray technology revolutionized the domain. Most of the genetic research laboratories have invested in these new tools. The goal of microarrays is to discover the function of the genes.
Image processing takes a very important place in this development. Its goal is to make a rigorous analysis of the output images since without this step data would be of no use to biologists. The researchers of the BIG (Biomedical Imaging Group of the EPFL) have thought about a new solution for spots detection on very bad quality microarray images.
Microarrays images
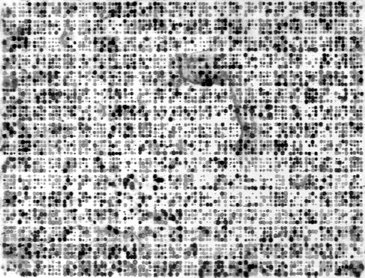
We work on images received from the A.I.Virtanen Institute, University of Kuopio, Finland (the miccroarrays were made on cellulose films using radioactive markers).
Features
The goal is to compute the intensity of each spot. |
|
Overview of our method
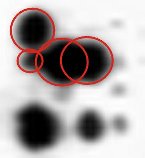
The idea is based on an article by N. Brändle, H-Y. Chen, H. Bischof and H. Lapp, entitled “Robust Parametric and Semi-parametric Spot Fitting for Spot Array Images”. We will associate a gaussian model to each spot in order to fit the real spot if possible. Knowing the accurate parameters of the gaussian model will allow us to compute the volume of each spot.

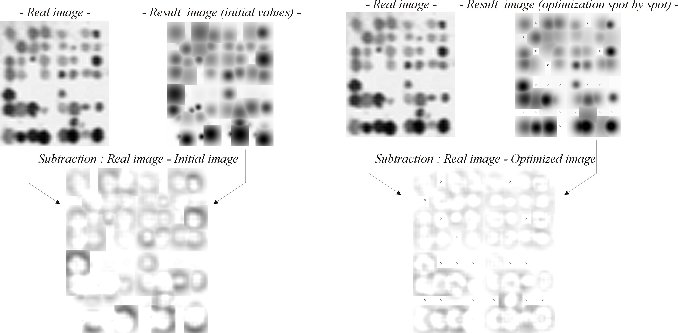
Results
To test the method, we have created a program in IDL with a graphical interface. This interface allows the user to make an easy initialization, to save and to graphically visualize the results. The following figure shows the result images, constructed with the gaussian model associated with each spot : first approximation of the gaussian model parameters (left), and optimization of these parameters (right). We can see that the differencies are minimum. The chosen model is fitting.