Functionalities
Studies On Image Directionalies
Download
Plugins for ImageJ
Java source code
Version 2.0.7
21 October 2024
A series of ImageJ plugins for directional image analysis

| |
|
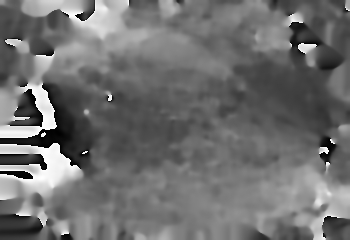
Slow variation of the local window of the gradient structure tensor |
ImageJ Macro to produce this series of images |
Outline
The aim is to characterize the orientation and isotropy properties of a region of interest (ROI) in an image, based on the evaluation of the gradient structure tensor in a local neighborhood. The theoretical background is fully described in this PDF document. The software package OrientationJ automates the orientation analysis with four functionalities: performing a visual representation of the orientation of a image, creation of a vector field map, plotting the distribution of orientations, and detection of keypoints (Harris Corner). OrientationJ has also others tools: the manual measurement of the orientation and coherency in a ROI, the computation of the dominant orientation, the alignment of images based on the gradient structure tensor and some test images (chirp).
OrientationJ is a software package which consists of a series of plugins for ImageJ and Fiji. It is a open source project available on GitHub.
OrientationJ has a companion plugin MonogenicJ that performs multiresolution directional image analysis.
OrientationPy OrientationPy is the pythonic successor to the well-loved OrientationJ Fiji Plugin (github) from EPFL. It is a library that takes in 2D images or 3D volumes and computes the orientation of the greylevels. A key step is the computation of image gradients, for which we offer a number of different techniques.
References
Reference on the method
Z. Püspöki, M. Storath, D. Sage, M. Unser
Transforms and Operators for Directional Bioimage Analysis: A Survey
Advances in Anatomy, Embryology and Cell Biology, vol. 219, Springer International Publishing, ch. 3, 2016.
Reference on the angular distribution:
R. Rezakhaniha, A. Agianniotis, J.T.C. Schrauwen, A. Griffa, D. Sage, C.V.C. Bouten, F.N. van de Vosse, M. Unser, N. Stergiopulos
Experimental Investigation of Collagen Waviness and Orientation in the Arterial Adventitia
Biomechanics and Modeling in Mechanobiology, vol. 11, 2012.
Reference on the local measurements:
E. Fonck, G.G. Feigl, J. Fasel, D. Sage, M. Unser, D.A. Rüfenacht, N. Stergiopulos
Effect of Aging on Elastin Functionality in Human Cerebral Arteries
Stroke, vol. 40, no. 7, 2009.
Visual directional analysis
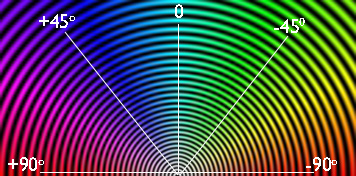 |
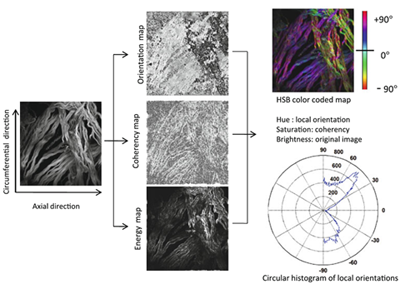
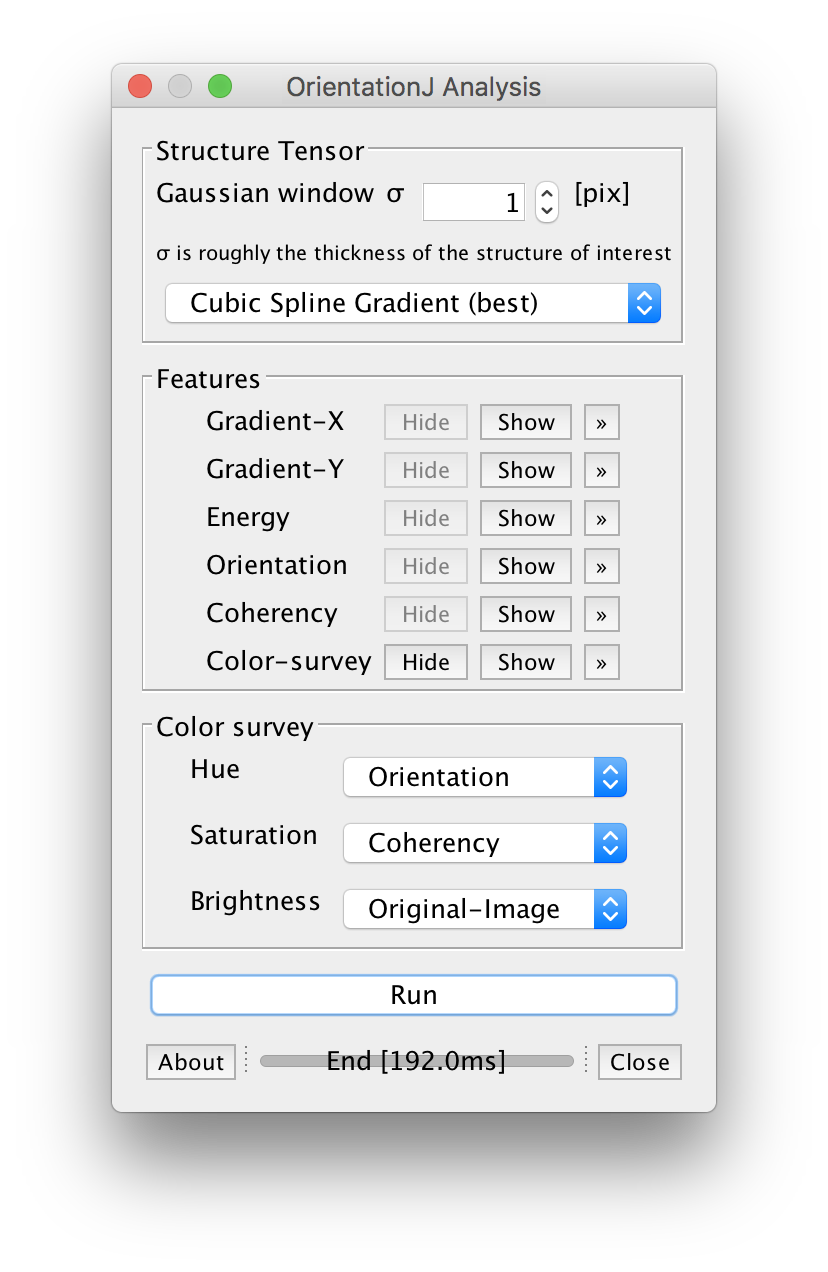
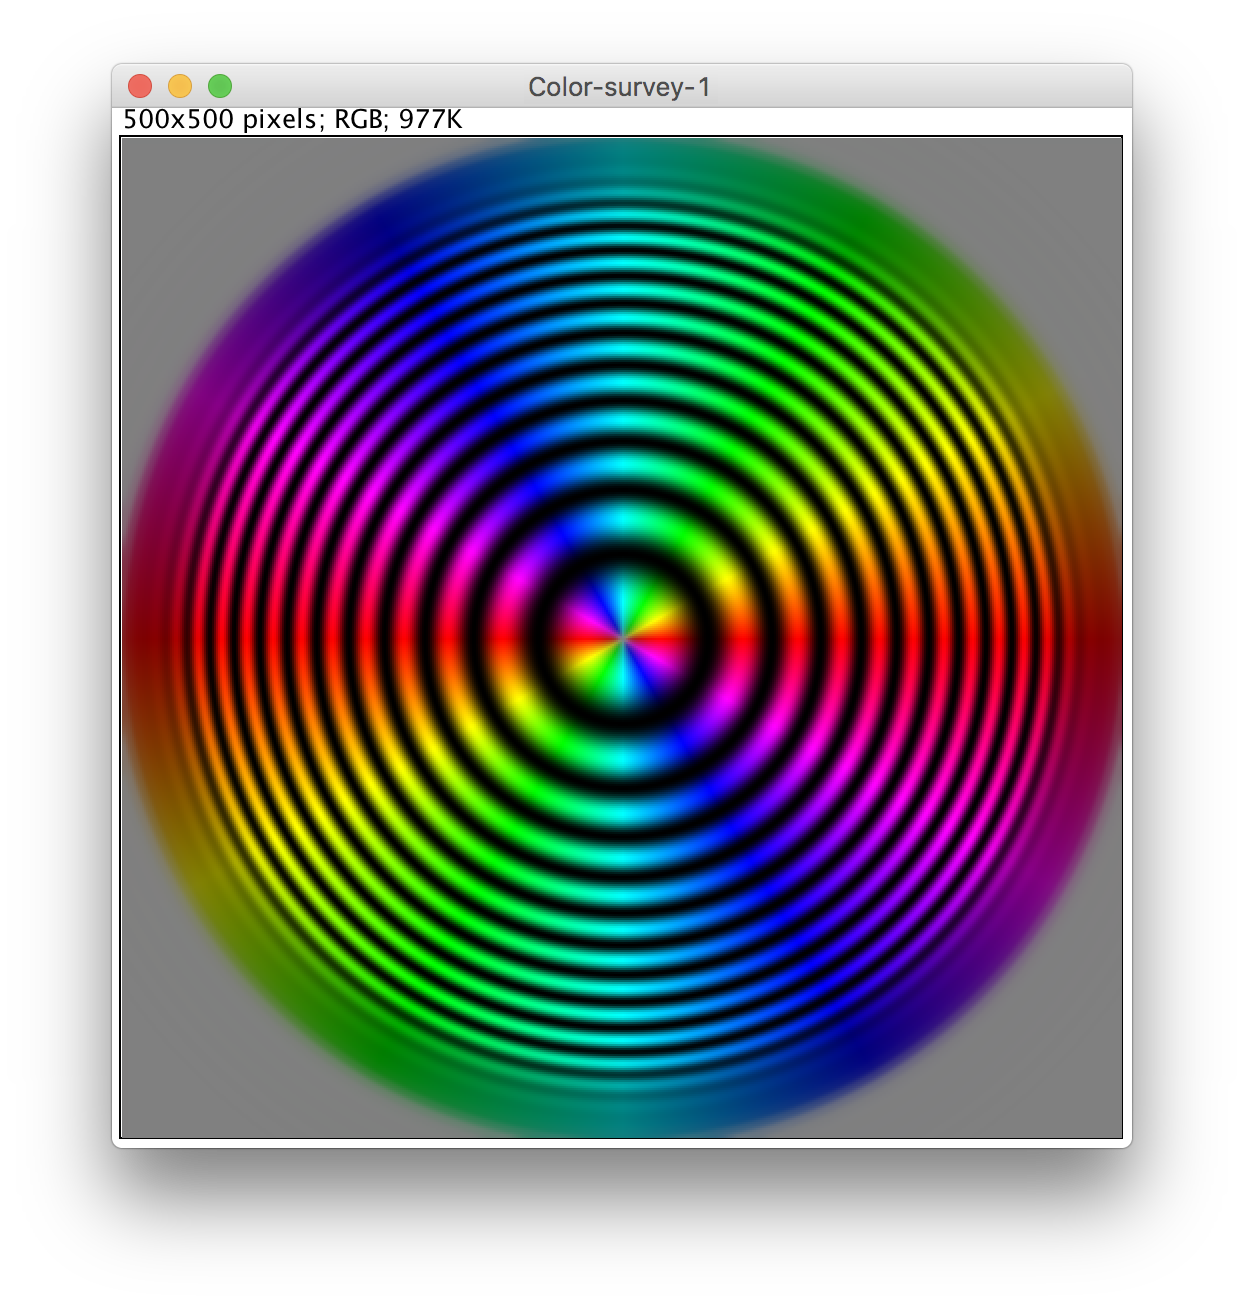
Qualitative or visual mode: the user specifies the size of a Gaussian-shaped window, and the program computes the structure tensor for each pixel in the image by sliding the Gaussian analysis window over the entire image. The local orientation properties are computed according to the equations above and are then visualized as gray level or color images with the orientation being typically encoded in the color (hue).
In the left example, the original image (source) is used as input of the structure tensor computation. The program computes the local orientation and the local coherency. The feature are gather in color map in HSB mode, e.g, hue is orientation, saturation is coherency, and brigthness is the source image.
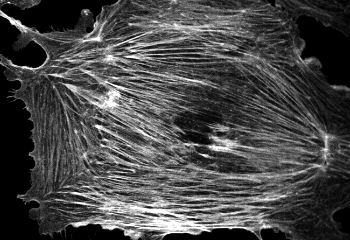 Original image |
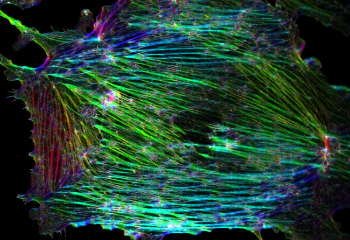 Color survey |
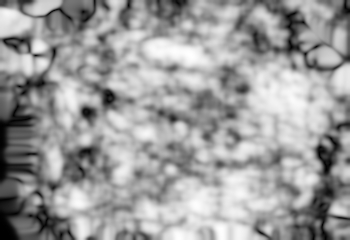 Coherency |
 Orientation |
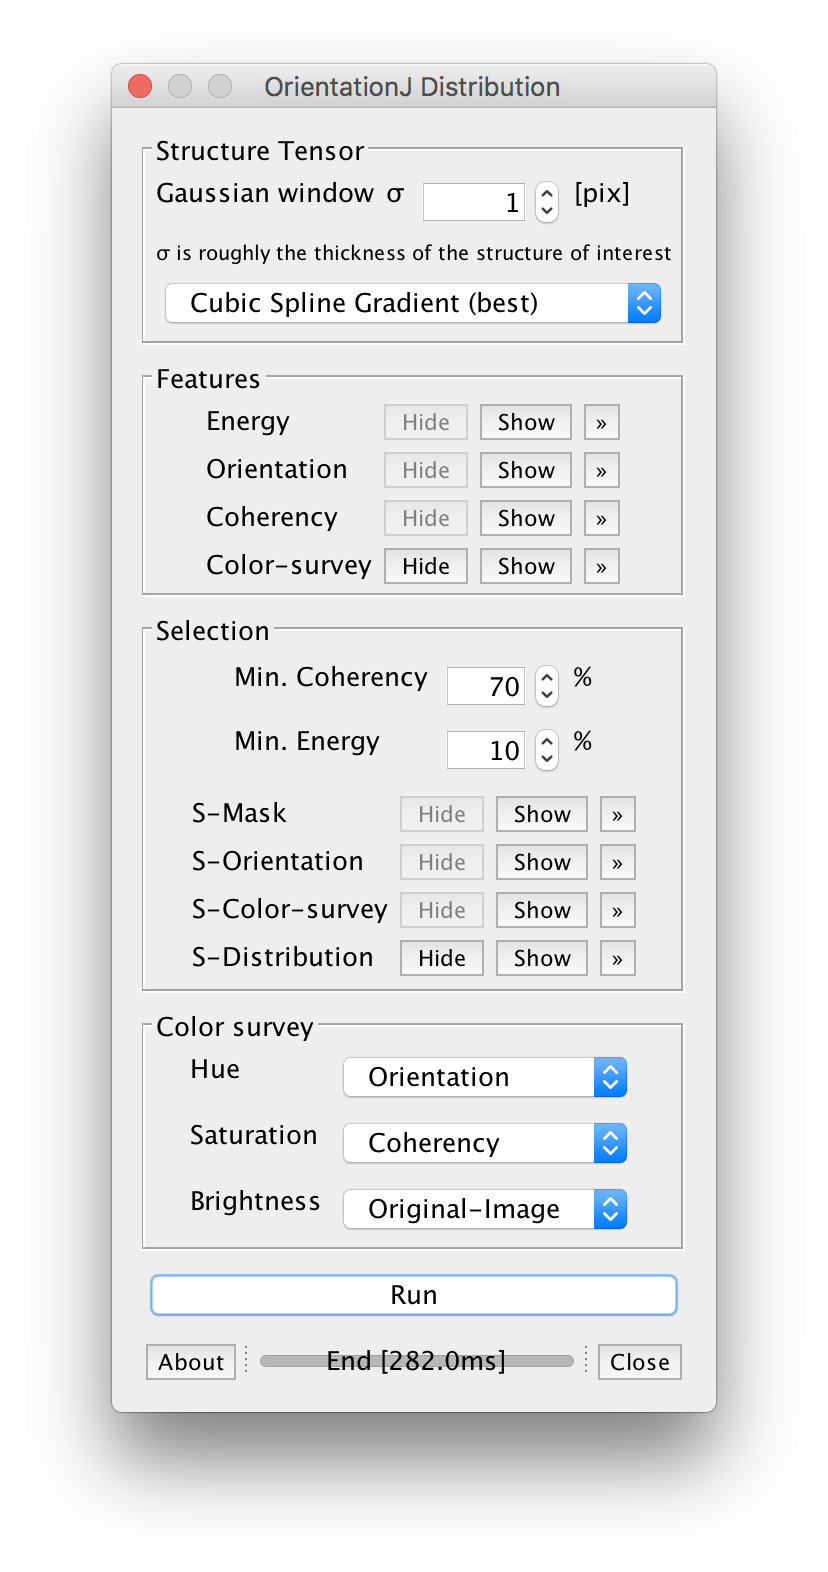
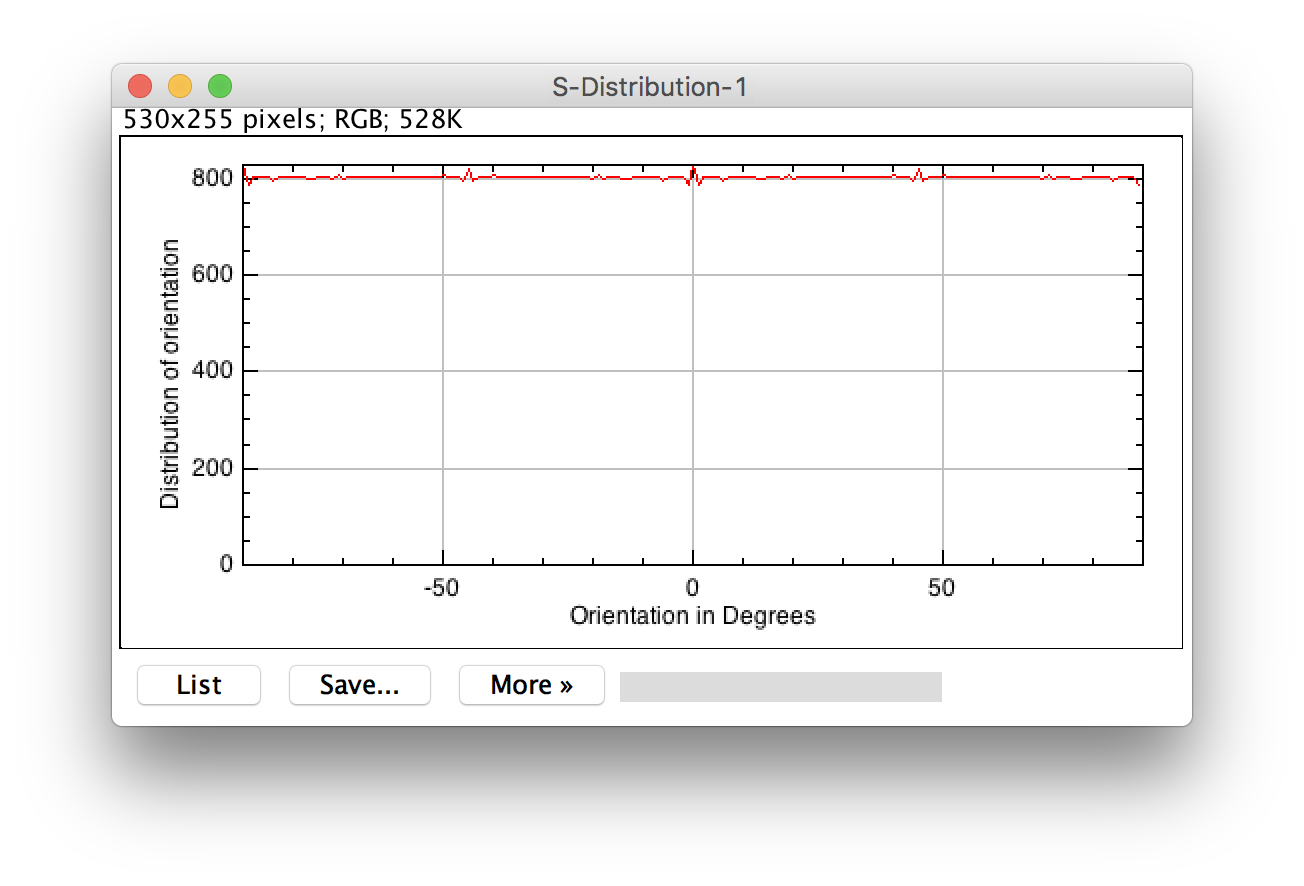
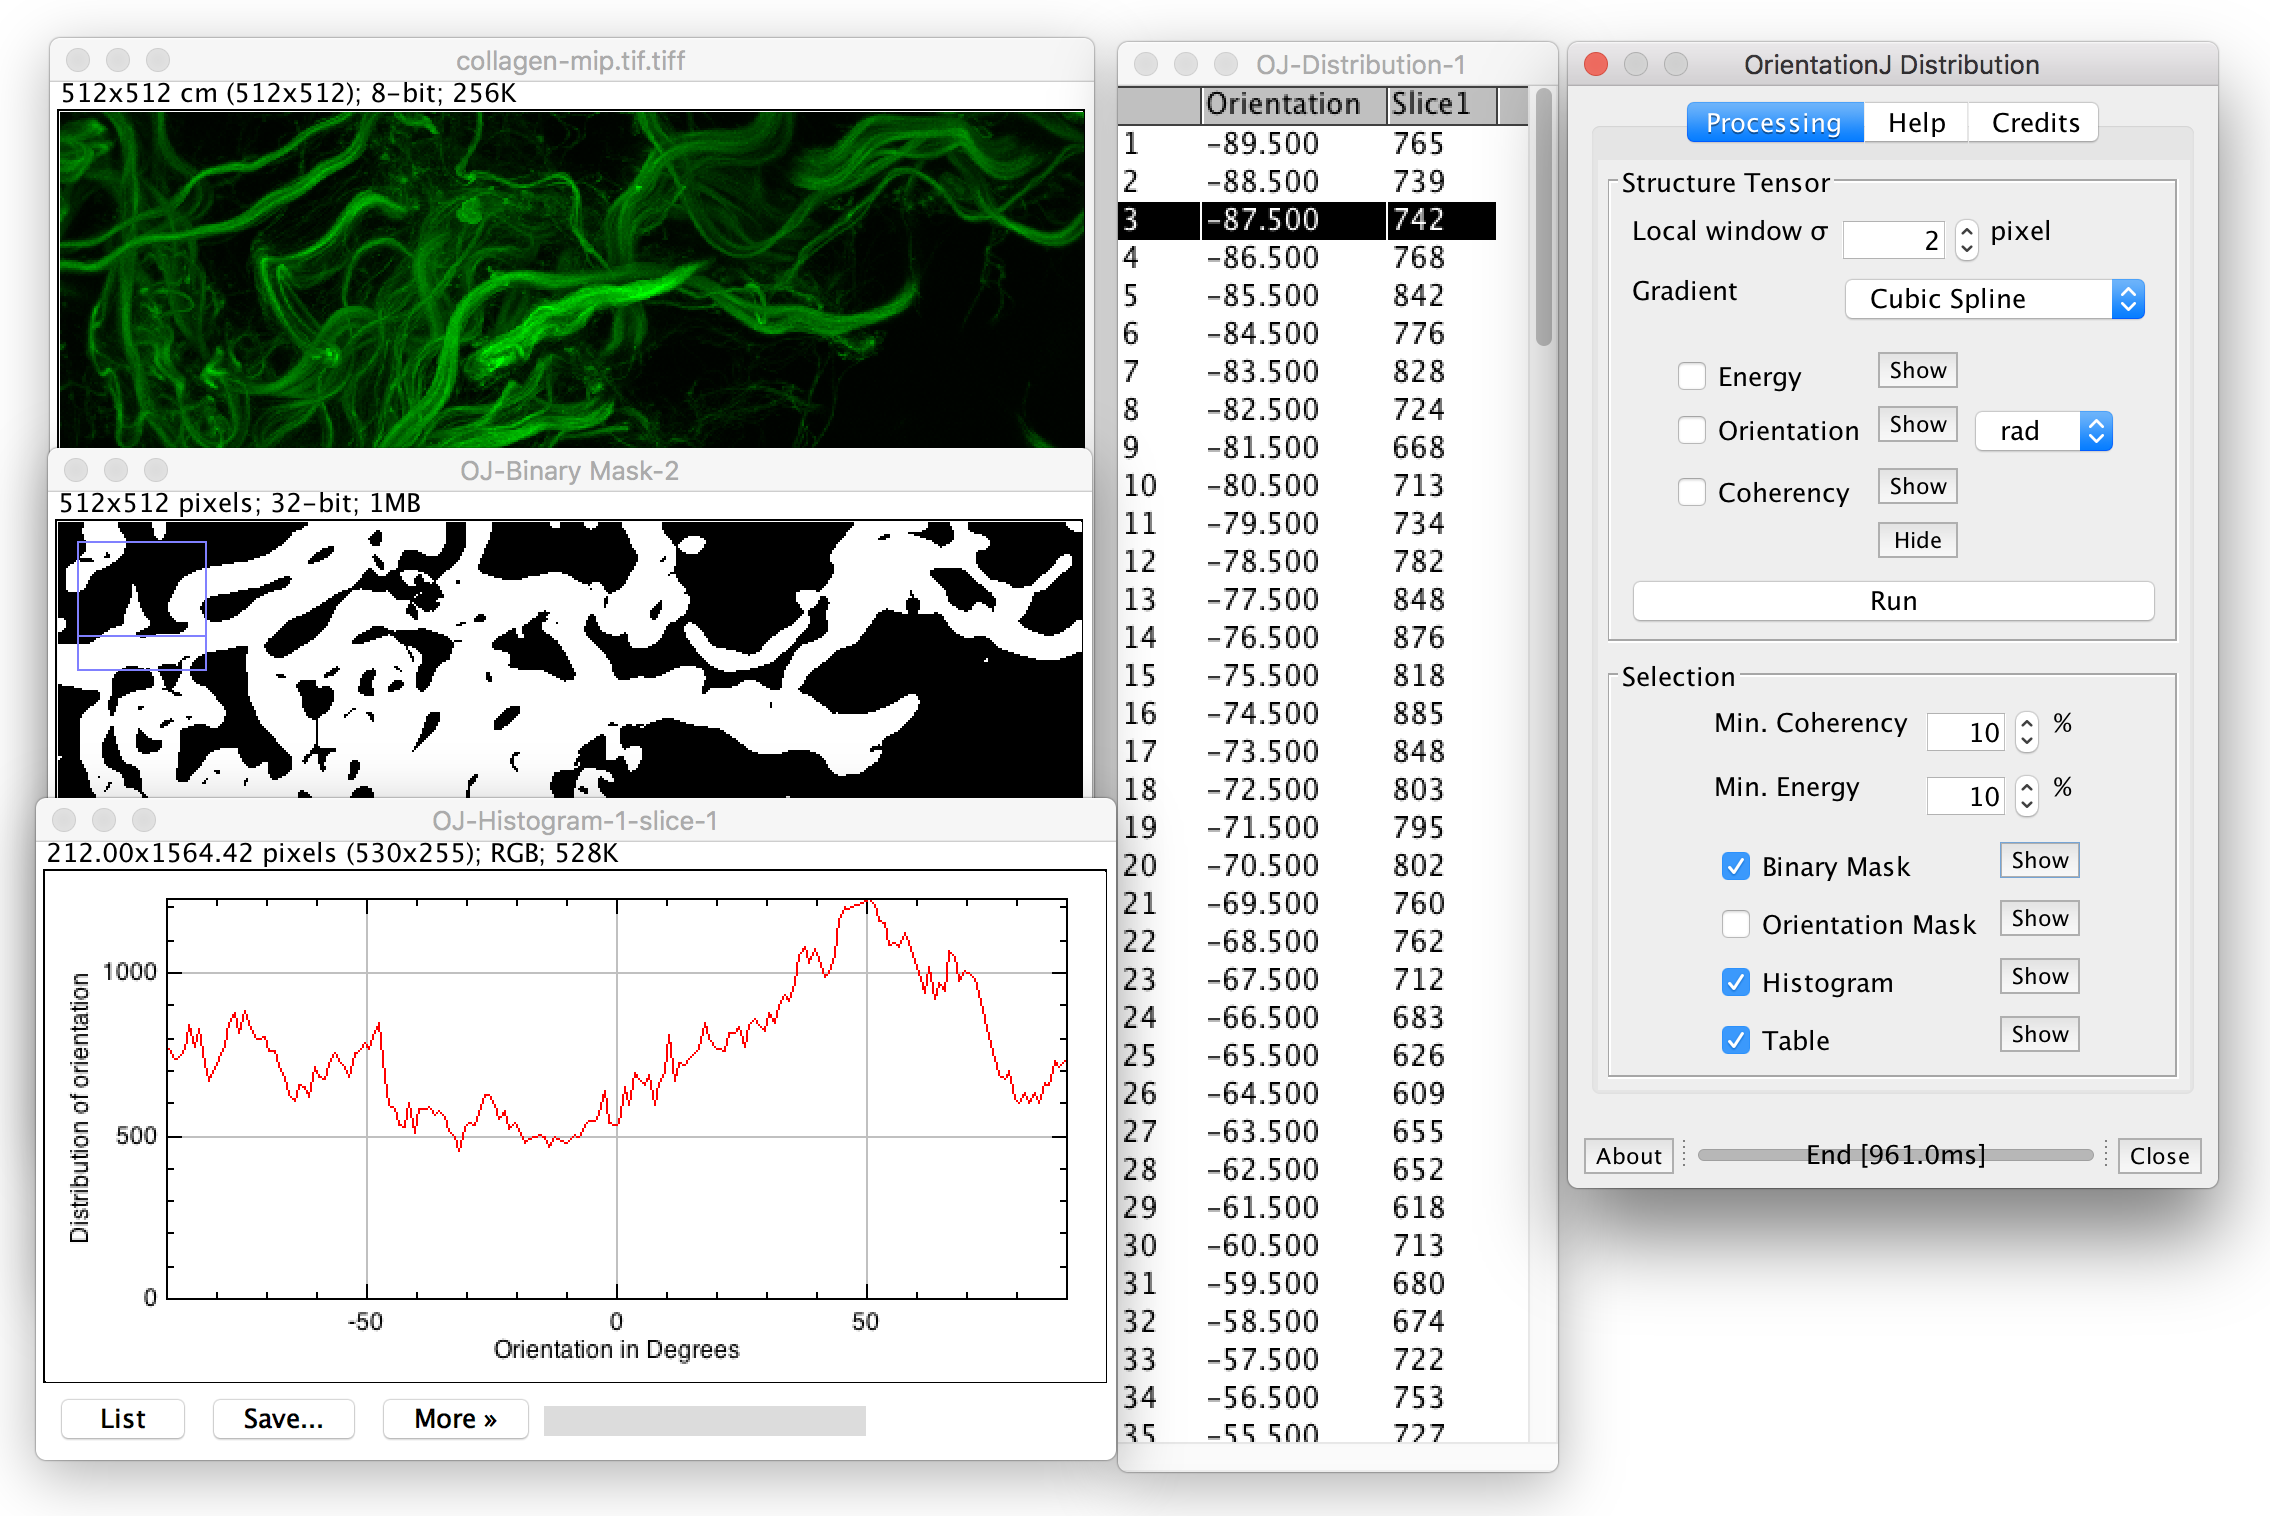
Distribution of orientations
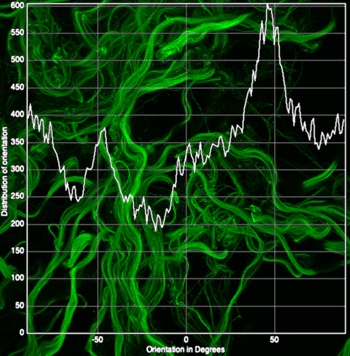 |
The orientation is evaluated for every pixel of the image based on the structure tensor. A histogram of orientations is built taken into account the pixel that have a coherency larger than min-coherency and an energy larger than min-energy. The histogram is a weighted histogram, the weigth is the coherency itself. The min-coherency is expressed is % since the coherency factor is a index between 0 and 1. The min-energy is expressed in % of the maximum energy of the image.
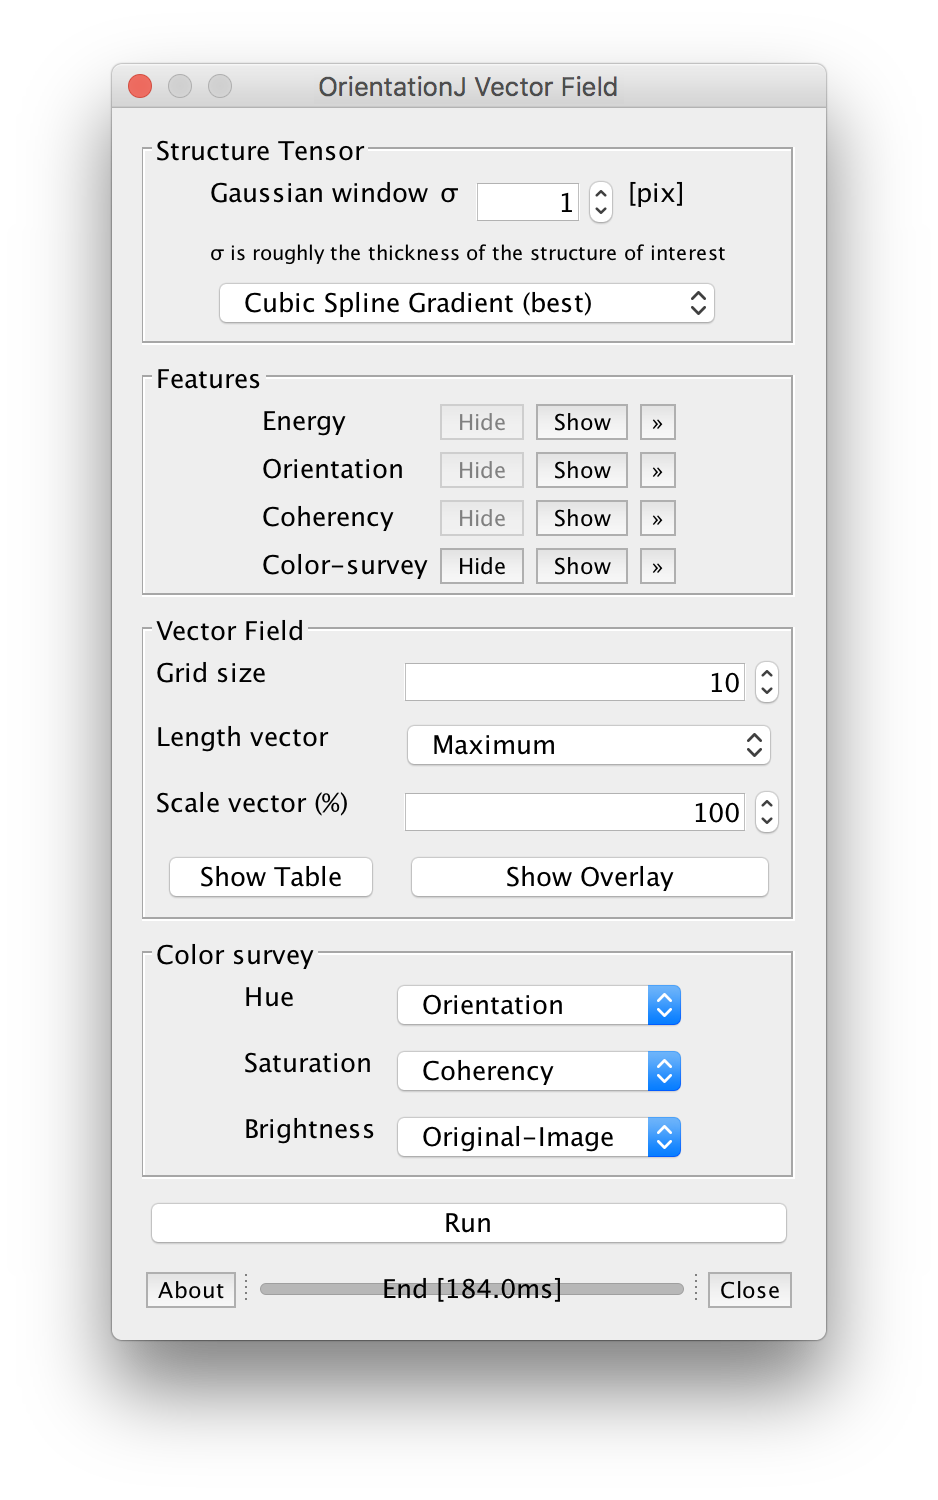
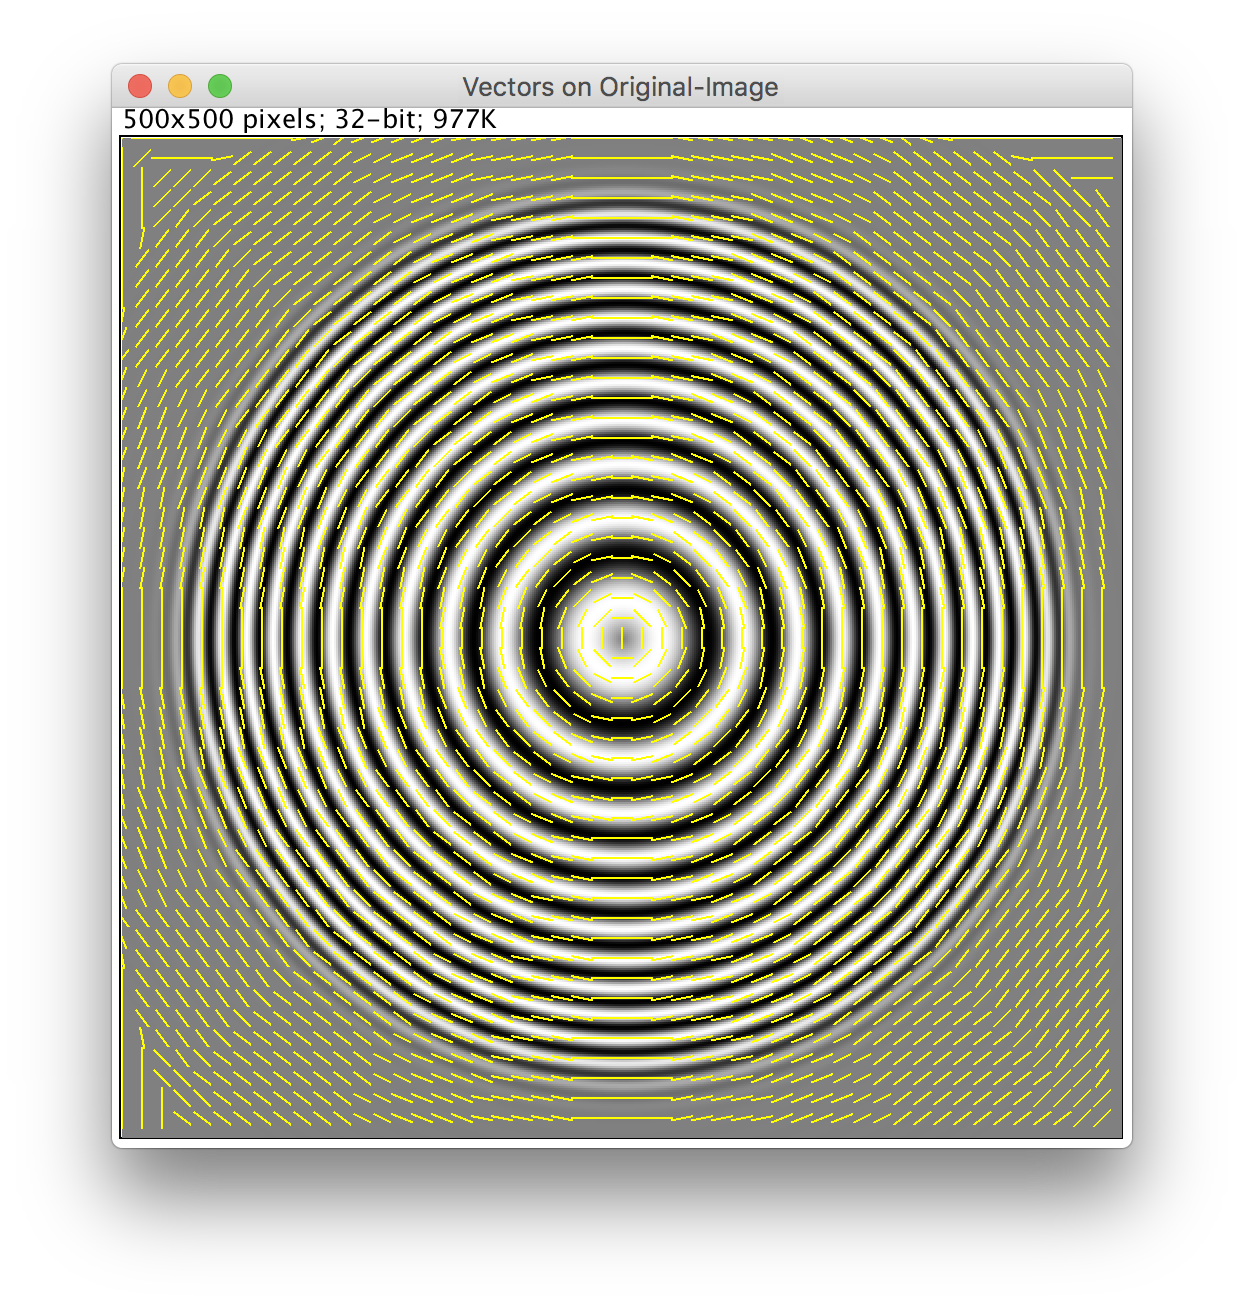
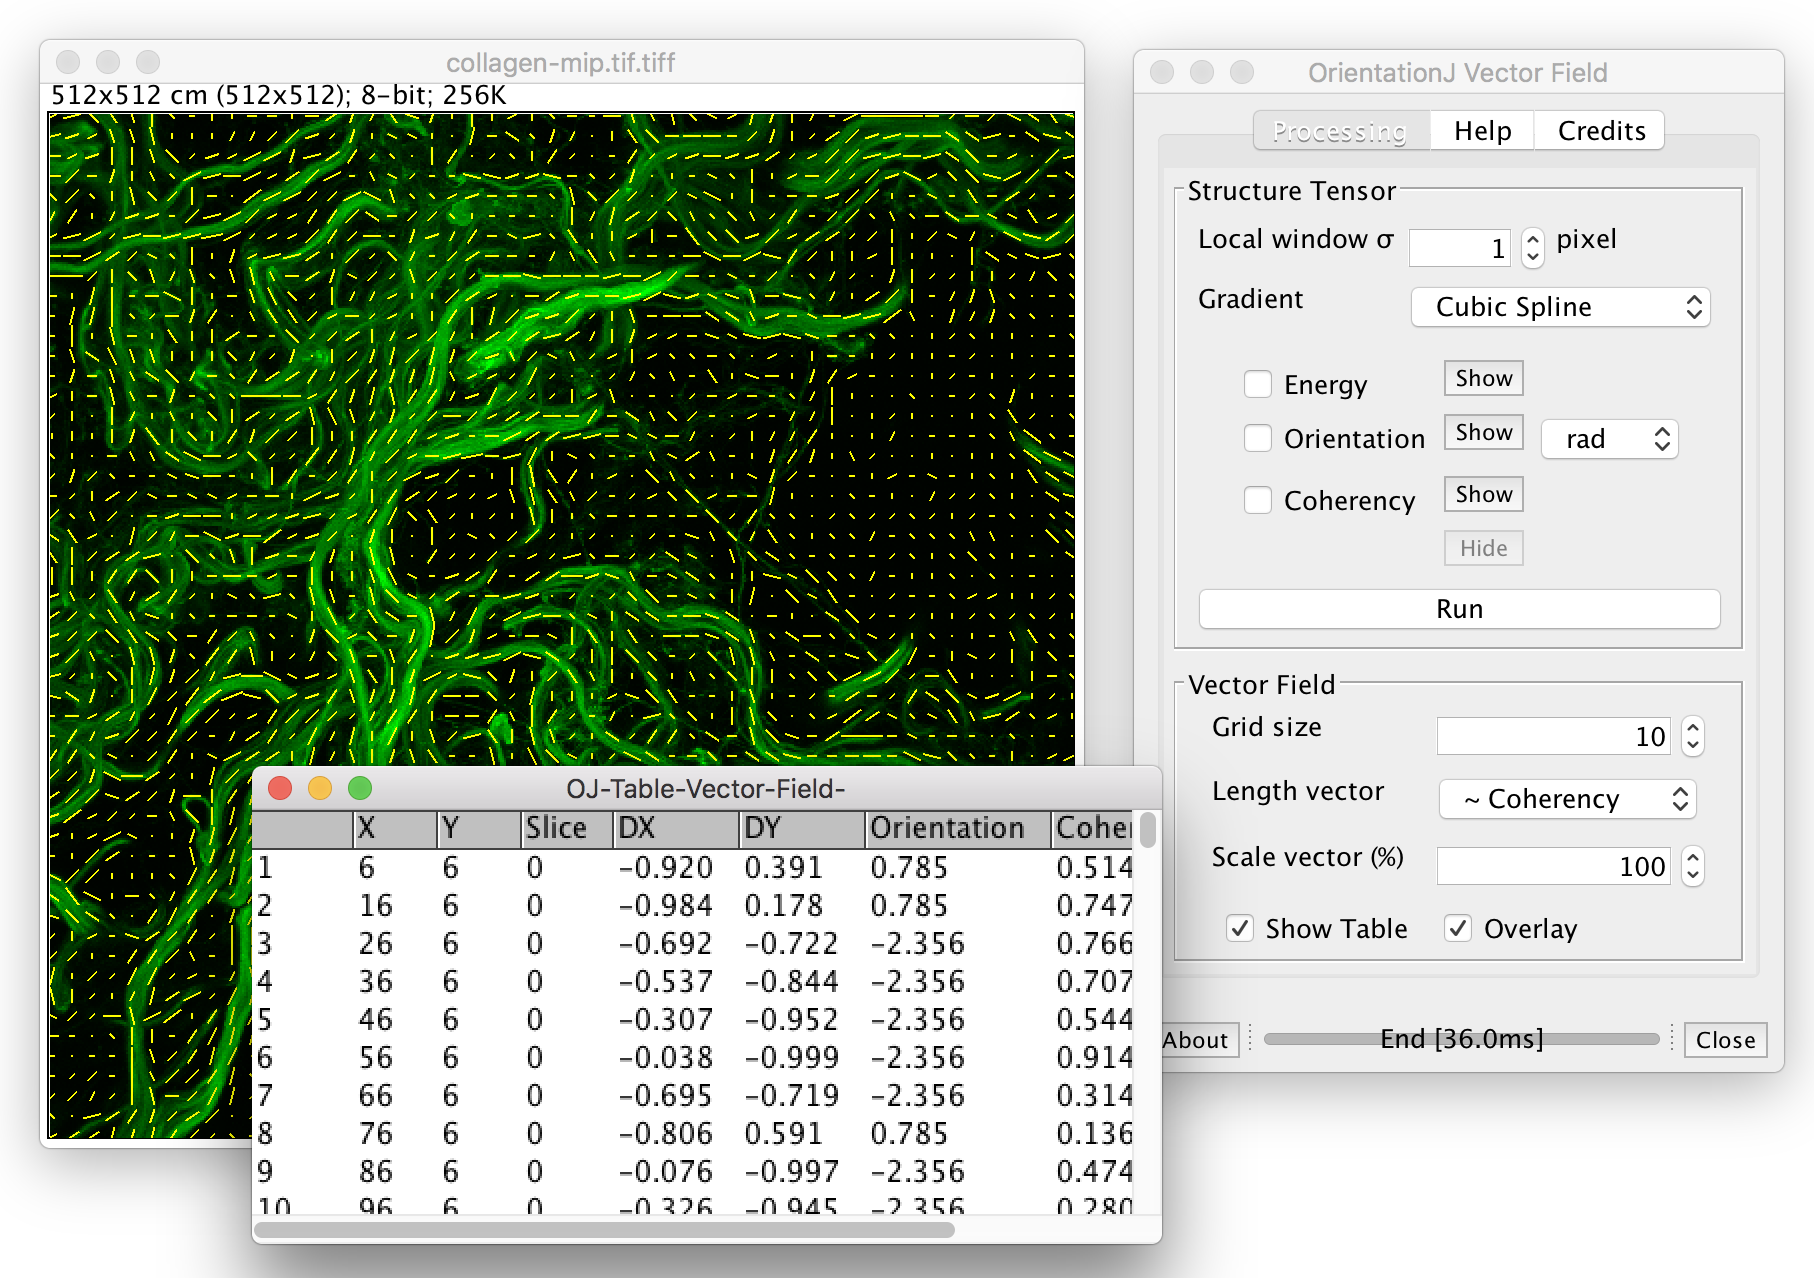
Vector Field
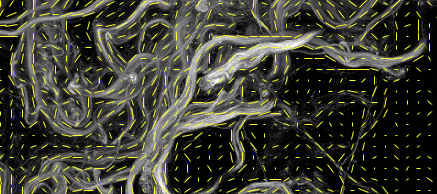 |
The orientation is evaluated for every patch of the image based which allows to visualize the orientation of the vector. The module of the vector is usually proportional to the coherency and a scale factor provided by the user.
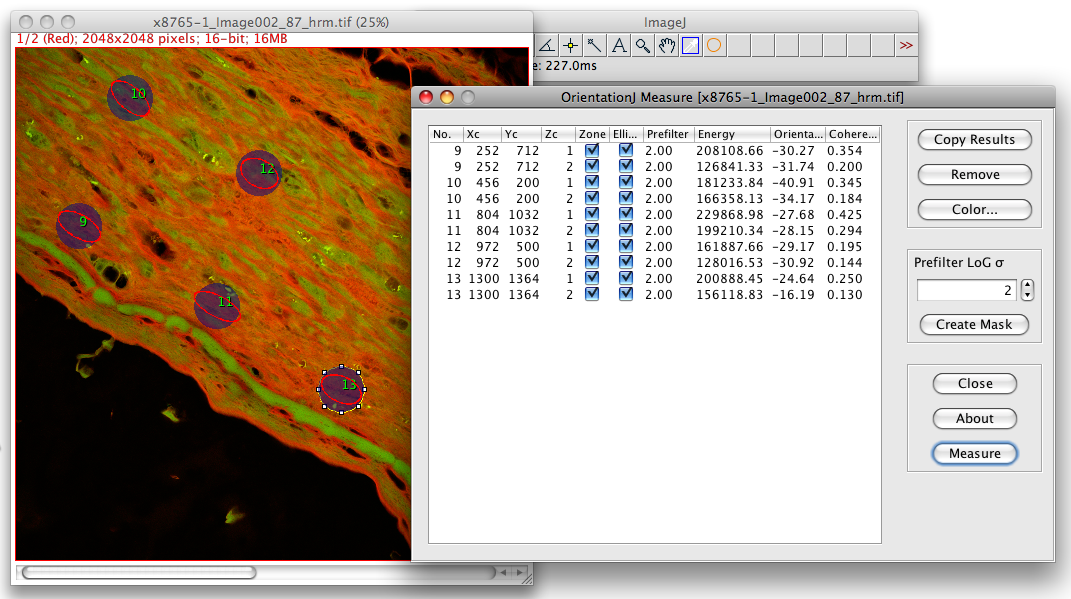
Quantitative orientation measurement
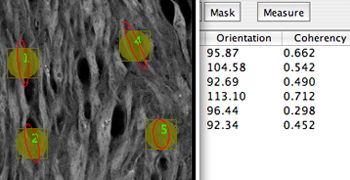 |
Quantitative mode: the user specifies a sequence of ROIs and the software saves the corresponding orientation features in a spreadsheet. The weighting function in this mode is the ROI window with uniform weights.
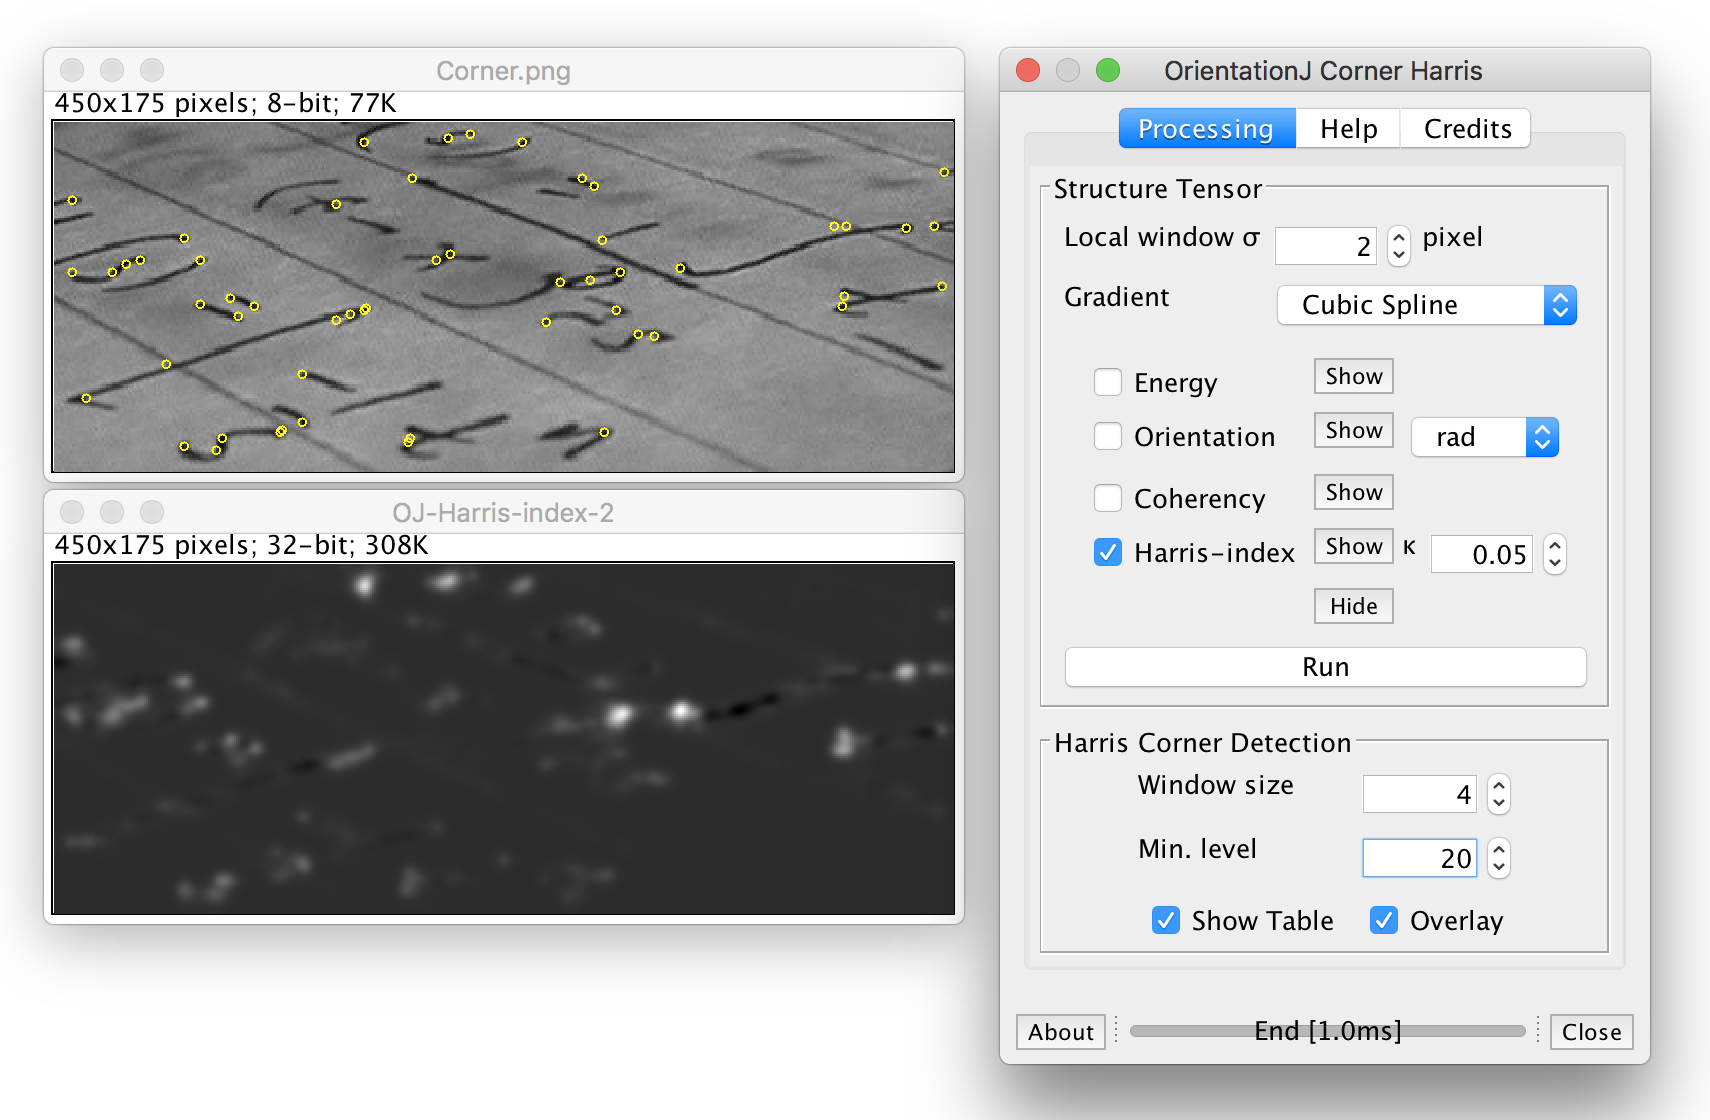
Harris corner detection
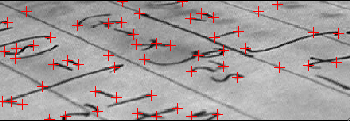 |
Based on structure tensor computation, the Harris index is evaluated. The local maximum of the Harris index represent corners in images.
Software
Free and easy-to-use software
We provide a software OrientationJ to produce to visualize and to measure the orientation in the images. This software package is a series of plugin running on ImageJ, Fiji, or ImageJ2 a general purpose image-processing package. ImageJ has a public domain licence; it runs on several plateforms: Linux, Windows, Mac OSX.
Installation
ImageJ Macro
The OrientationJ plugins are recordable on ImageJ.
Example of macro: OrientationJ Analysis
// Call the Analysis plugin from a ImageJ macro
run("Straight Lines");
run("OrientationJ Analysis", "tensor=1.0 gradient=0 color-survey=on hue=Orientation sat=Coherency bri=Original-Image ");
// tensor: value of the standard deviation of the Gaussian local window of the structure tensor
// gradient: index of the used gradient (0: Cubic Spline, 1: Finite difference, 2: Fourier; 3: Riesz, 4: Gaussian)
// color-survey: to display the color-coded HSB
//...
Example of macro: OrientationJ Measure
// Call the Measure plugin from a ImageJ macro
makeRectangle(250, 250, 50, 50);
run("OrientationJ Measure", "sigma=.0.0");
// sigma: standard deviation of the Laplacian of Gaussian prefilter
// The results are displayed on the log window of ImageJ in tab-separated format
Example of macro: Comparison of the isotropic properties of the gradient
run("Chirp Image Custom", "width=512 height=512");
selectWindow("Chirp");
run("OrientationJ Distribution", "tensor=1.0 gradient=0 radian=on histogram=on min-coherency=20.0 min-energy=10.0 ");
rename("Histogram Cubic Spline)");
selectWindow("Chirp");
run("OrientationJ Distribution", "tensor=1.0 gradient=1 radian=on histogram=on min-coherency=20.0 min-energy=10.0 ");
rename("Histogram (Finite Difference)");
selectWindow("Chirp");
run("OrientationJ Distribution", "tensor=1.0 gradient=2 radian=on histogram=on min-coherency=20.0 min-energy=10.0 ");
rename("Histogram (Fourier)");
selectWindow("Chirp");
run("OrientationJ Distribution", "tensor=1.0 gradient=4 radian=on histogram=on min-coherency=20.0 min-energy=10.0 ");
rename("Histogram (Gaussian)");
Versions
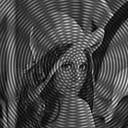
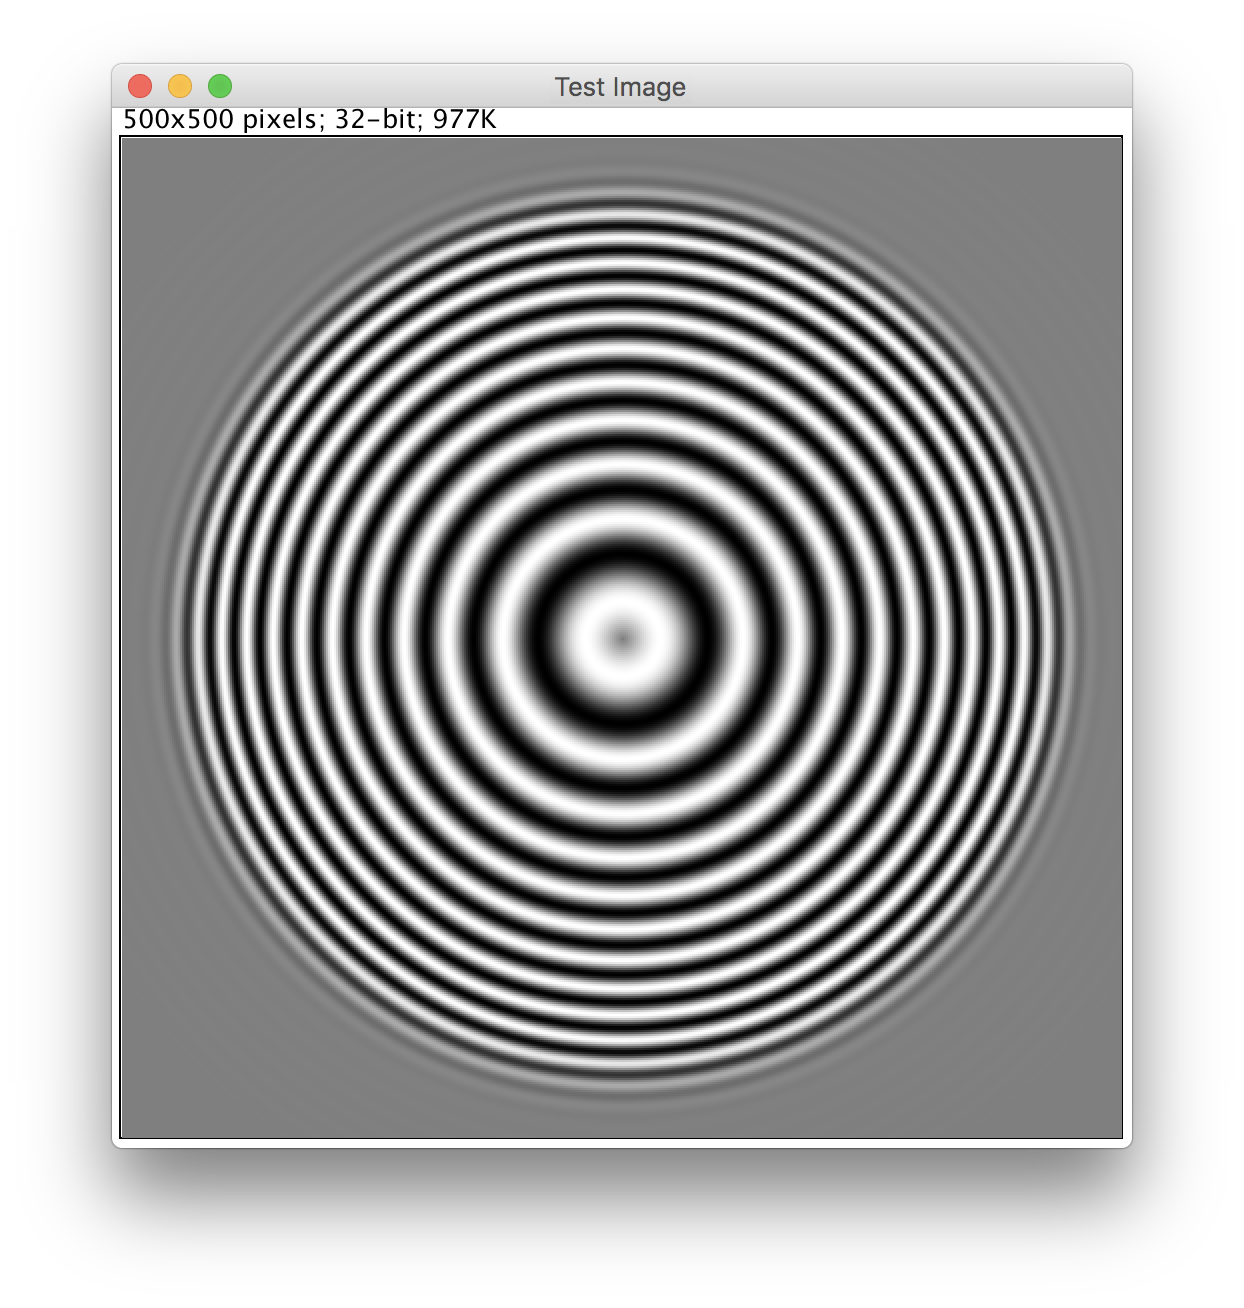
Test images
|
|

|
|
|
|
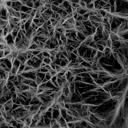
artificial fibers |
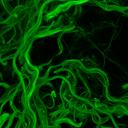
collagen-mip |
test-orientation |
Ms. Steerable |
chirp |
Analysis on Test Image |
||
 |
 |
 |
Vector Field on Test Image |
|
 |
 |
Distribution on Test Image |
|
 |
 |
On the orientation analysis of digitized images
Helmut Günder
http://www.gluender.de/Writings/WritingsTexts/HardText.html#Gl-2013-1
Validation of the fiber orientation
Reference: Erica E. Morrill, Azamat N. Tulepbergenov, Christina J. Stender, Roshani Lamichhane, Raquel J. Brown, Trevor J. Lujan, A validated software application to measure fiber organization in soft tissue Biomechanics and Modeling in Mechanobiology, December 2016.
DiameterJ
DiameterJ is a validated nanofiber diameter characterization tool. DiameterJ is able to analyze an image and find the diameter of nanofibers or microfibers at every pixel along a fibers axis and produces a histogram of these diameters.
Reference: Hotaling NA, Bharti K, Kriel H, Simon Jr. CG. DiameterJ: A validated open source nanofiber diameter measurement tool. Biomaterials 2015.
ImageJ plugin: Directionality
This plugin is used to infer the preferred orientation of structures present in the input image. It computes a histogram indicating the amount of structures in a given direction.
Software: https://imagej.net/Directionality.
Application Cases of OrientationJ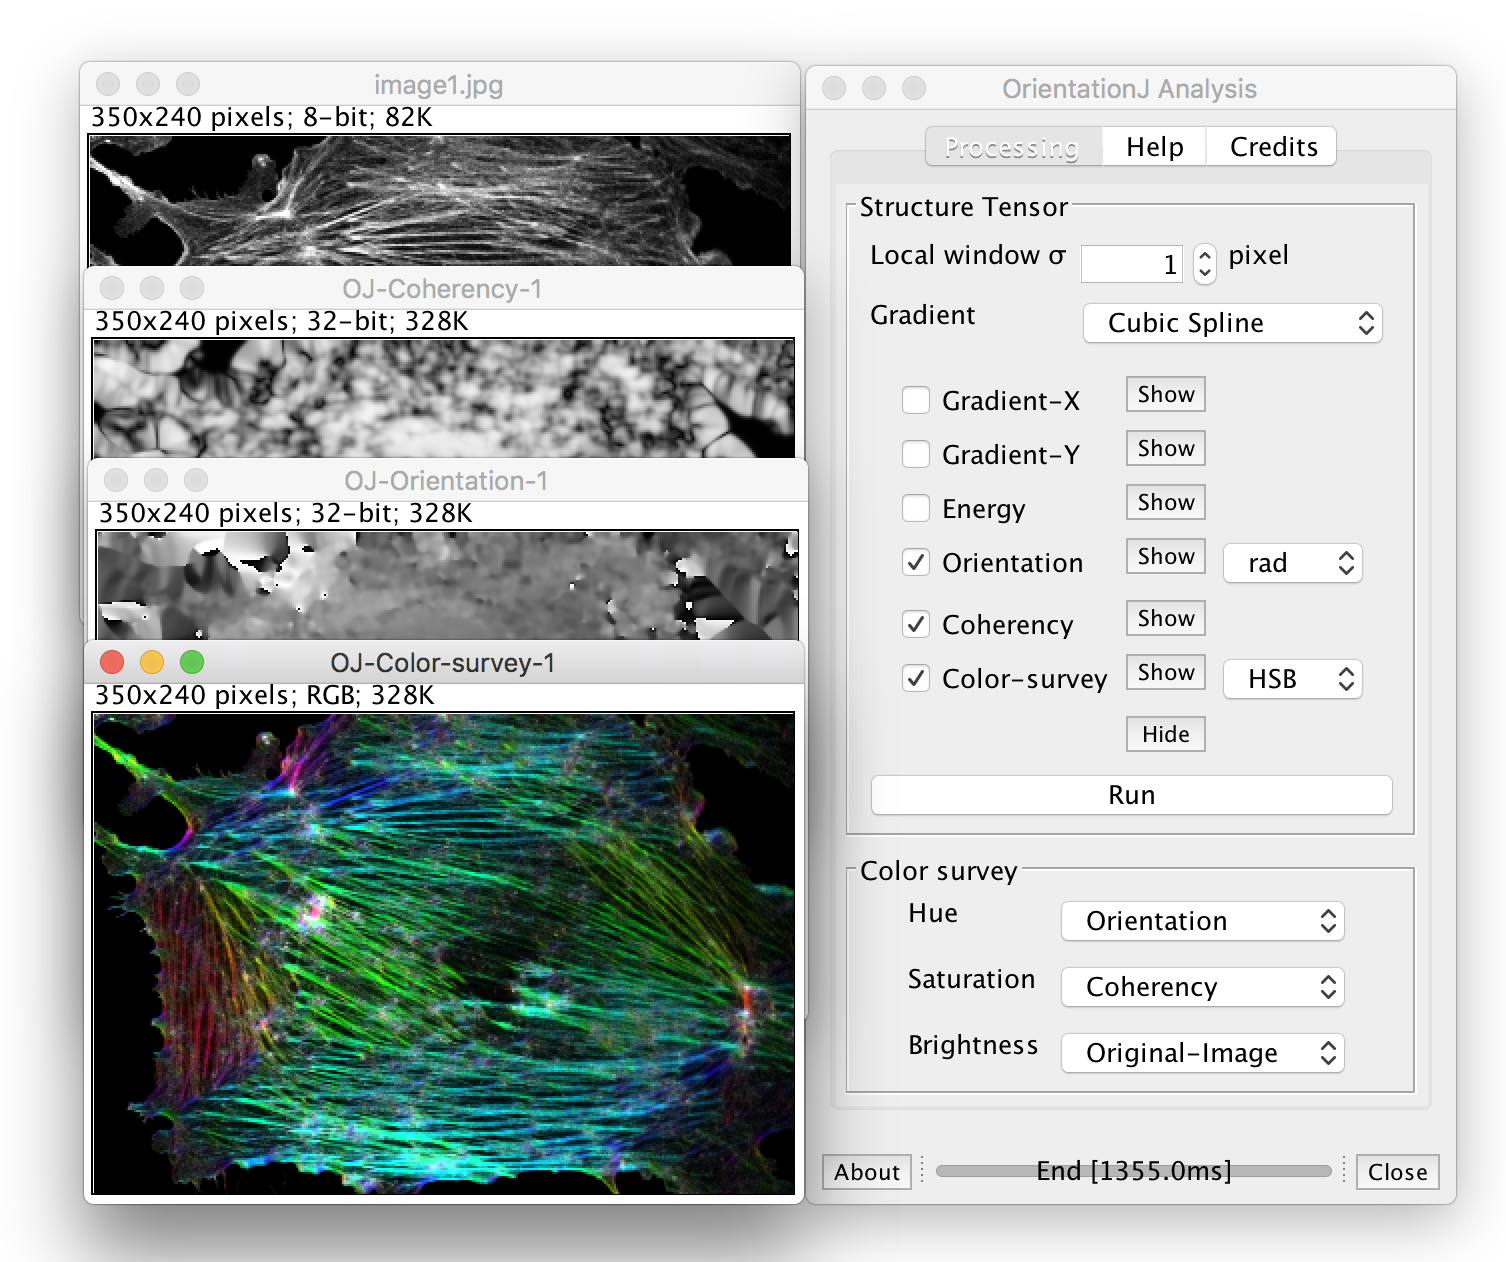